最新资源


简介
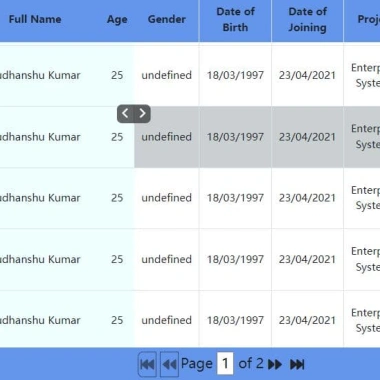
supergrid.js是一个功能强大、灵活且可自定义的数据表/网格jQuery插件,用于在网页上操作和显示表格数据。
主要功能:
- 同时支持Bootstrap 5和jQuery UI主题。
- 从对象数组中加载表格数据。
- 将表头固定到顶部。
- 将特定数量的表列固定在左侧。
- 完全可自定义的分页控件。
- 一个方便的基于复选框的系统,用于选择多行。
- 可调整表列的大小。
- 还有更多。
如何使用它:
1.在文档中加载必要的jQuery库、Bootstrap 5框架(或jQuery UI)和Font Awesome 6标志性字体。
- <!-- jQuery is required -->
- <script src="/path/to/cdn/jquery.min.js"></script>
- <!-- Bootstrap 5 -->
- <link rel="stylesheet" href="/path/to/cdn/bootstrap.min.css" />
- <script src="/path/to/cdn/bootstrap.bundle.min.js"></script>
- <!-- Font Awesome 6 -->
- <link rel="stylesheet" href="/path/to/cdn/all.min.css" />
2.在页面上创建一个空表。
- <table id="example"></table>
3.准备表格数据。
- const data = [
- {
- id:0,
- name:"jQueryScript",
- age: "26",
- gender:"male",
- dob: "18/03/1997",
- // ...
- },
- // ...
- ]
4.初始化插件,并根据您提供的数据生成一个基本数据表。
- $("#example").superGrid({
- data: Data,
- colModel:[
- {
- name: "name",
- label: "Full Name",
- width: "150",
- resizable: true,
- },
- {
- name:"age",
- label:"Age",
- colDataType:"form",
- // text
- // number
- // radio
- // checkbox
- // password
- // date
- // time
- // textarea
- formInputType:"date",
- },
- {
- name: "gender",
- label: "Gender",
- colDataType: "form",
- formInputType: "select",
- selectOptions: ["Male", "Female","Others"]
- },
- {
- name:"dob",
- label:"Date of Birth",
- hidden: true
- },
- // ...
- ]
- });
5.完整的插件选项。
- $("#example").superGrid({
- // or 'jqueryui'
- theme: "bootstrap5",
- // text to display when no results
- defaultMsg: "Nothing to show...",
- // sticky table header
- stickyHeader: true,
- // sticky table columns
- stickyCols: 0,
- // shows a scroller for wider table
- scroller: false,
- scrollSpeed: 100,
- // enable pagination controls
- pager: true,
- // number of rows to display per page
- rowsPerPage: 20,
- // number the rows across the table
- rowNumbering: true,
- // enable multiselect
- multiSelect: false,
- });
预览截图
 强大且可自定义 jQuery数据表/网格插件 supergrid.js