最新资源


简介
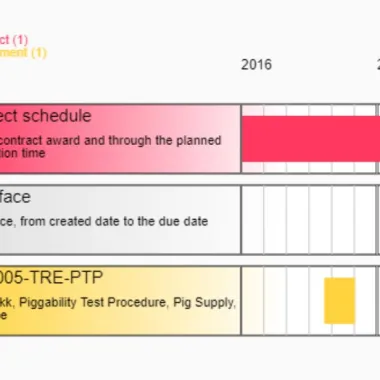
一个轻量级的开源jQuery插件,可以帮助开发人员在页面上生成简单的、可定制的、基于HTML5画布的甘特图。它依赖于day.js或moment.js进行日期解析。
该插件提供了项目时间表的清晰可视化表示,可以帮助您识别潜在问题,并根据需要调整项目进度。甘特图上的条形图表示每个任务的持续时间,可用于显示每个任务的开始日期和结束日期。
参见:
- JavaScript中的10个最佳甘特图插件
- Javascript和CSS中的10个最佳条形图(柱形图)插件
如何使用它:
1.在文档中加载所需的jQuery和Day.js库。
<script src="/path/to/cdn/jquery.min.js"></script>
<script src="/path/to/cdn/dayjs.min.js"> </script>
2.下载并加载jQuery simpleGantt.js。
<script src="./simpleGantt.js"></script>
3.创建一个HTML5帆布用于甘特图。
<canvas id="myGantt"></canvas>
4.将任务添加到甘特图中,并定义每个任务的开始日期和结束日期,如下所示:
var data = {
    "Start": "2016-07-01T00:00:00",
    "End": "2019-07-01T00:00:00",
    "TotalDays": 1095.0,
    "DateProgress": 82,
    "Years": [2016, 2017, 2018, 2019],
    "Months": [1, 2, 3, 4, 5, 6, 7, 8, 9, 10, 11, 12],
    "ScheduleType": "interface",
    "Id": 13488,
    "Tasks": [
      {
        "Name": "Project schedule",
        "Start": "2016-07-01T00:00:00",
        "End": "2019-07-01T00:00:00",
        "Description": "From contract award and through the planned execution time",
        "Progress": 0,
        "TaskType": "project",
        "Id": 6,
        "DateProgress": 82
      },
      {
        "Name": "Interface",
        "Start": "2018-12-12T00:00:00Z",
        "End": "2019-01-12T00:00:00Z",
        "Description": "Interface, from created date to the due date",
        "Progress": 0,
        "TaskType": "interface",
        "Id": 13488,
        "DateProgress": 6
      },
      {
        "Name": "V12005-TRE-PTP",
        "Start": "2018-03-19T00:00:00",
        "End": "2018-05-07T00:00:00",
        "Description": "Trestakk, Piggability Test Procedure, Pig Supply, Propipe",
        "Progress": 0,
        "TaskType": "document",
        "Id": 5250,
        "DateProgress": 100
      }]
};
5.初始化甘特图插件。
$('#myGantt').simpleGantt({
  data: data,
});
6.通过覆盖如下所示的默认选项来自定义甘特图。
$('#myGantt').simpleGantt({
  lineColor: 'black',
  lineWidth: 1,
  margin: 5,
  scale: true,
  taskHeight: 60,
  taskSpacing: 10,
  taskContentHeight: 20,
  headingHeight: 50,
  drawTaskBoxes: true,
  drawYearLines: true,
  drawMonthLines: true,
  monthLineColor: '#c9c9c9',
  showMonthNames: true,
  showDescriptions: true,
  legends: true,
  taskColorGradients: true,
  showNowLine: true,
  showCounters: true,
  legendVerticalSpacing: 3,
  nowLineColor: 'red',
  nowLineWidth: 2,
  maxMonths: 30,
  taskTitle: {
    font: "15px Arial",
    color: 'black'
  },
  taskDescription: {
    font: "11px Arial",
    color: 'black'
  },
  heading: {
    height: 60,
    start: 250,
    font: "12px Arial"
  },
  defaultColor: '#e0e0e0'
});
预览截图
 基于画布 甘特图插件 jQuery simpleGantt.js