
最新资源


简介
甘特图是一种条形图,可用于在二维时间线界面中可视化数据(活动和计划任务)。
IBM Gantt Chart是一个JavaScript库,它提供了一种简单的方法来实现可定制的、专业的、功能齐全的在线Gantt图表生成器,用于在现代web应用程序上安排任务。
特征:
- 可与jQuery、Vanilla JavaScript和React.js框架配合使用。
- 可折叠的任务名称。
- 反应灵敏,可自动适应您的布局。
- 自定义日期格式。
- 自定义时间表渲染和布局。
- 允许用户放大/缩小甘特图。
- 允许用户筛选和搜索数据。
- 支持AJAX数据提取。
- 支持任何类型的数据:“json”、“xml”、“html”或“text”。
基本用法:
1.加载样式表ibm-gantt-chart.css公司和JavaScriptibm-gantt-chart.js公司来自dist文件夹。
<link href="./dist/ibm-gantt-chart.css" rel="stylesheet" />
<script src="./dist/ibm-gantt-chart.js"></script>
2.为甘特图创建一个占位符。
<div id="gantt"></div>
3.在JS数组中准备数据,该数组包含ID、名称和活动,如下所示。
var data = [
    {
      id: 'NURSES+Anne',
      name: 'Anne',
      activities: [
        {
          id: 'SHIFTS+Emergency+Monday+2+8',
          name: 'Emergency',
          start: 1474880400000,
          end: 1474902000000,
        },
      ],
    },
    {
      id: 'NURSES+Bethanie',
      name: 'Bethanie',
      activities: [],
    },
    {
      id: 'NURSES+Betsy',
      name: 'Betsy',
      activities: [
        {
          id: 'SHIFTS+Emergency+Wednesday+12+18',
          name: 'Emergency',
          start: 1475089200000,
          end: 1475110800000,
        },
        {
          id: 'SHIFTS+Emergency+Saturday+12+20',
          name: 'Emergency',
          start: 1475348400000,
          end: 1475377200000,
        },
        {
          id: 'SHIFTS+Consultation+Friday+8+12',
          name: 'Consultation',
          start: 1475247600000,
          end: 1475262000000,
        },
      ],
    },
    {
      id: 'NURSES+Cathy',
      name: 'Cathy',
      activities: [
        {
          id: 'SHIFTS+Emergency+Sunday+20+2',
          name: 'Emergency',
          start: 1475463600000,
          end: 1475485200000,
        },
        {
          id: 'SHIFTS+Emergency+Saturday+12+20',
          name: 'Emergency',
          start: 1475348400000,
          end: 1475377200000,
        },
        {
          id: 'SHIFTS+Emergency+Monday+18+2',
          name: 'Emergency',
          start: 1474938000000,
          end: 1474966800000,
        },
      ],
    },
    {
      id: 'NURSES+Cindy',
      name: 'Cindy',
      activities: [
        {
          id: 'SHIFTS+Emergency+Saturday+20+2',
          name: 'Emergency',
          start: 1475377200000,
          end: 1475398800000,
        },
        {
          id: 'SHIFTS+Consultation+Friday+8+12',
          name: 'Consultation',
          start: 1475247600000,
          end: 1475262000000,
        },
        {
          id: 'SHIFTS+Consultation+Tuesday+8+12',
          name: 'Consultation',
          start: 1474988400000,
          end: 1475002800000,
        },
      ],
    },
];
4.配置如何获取甘特图的资源。
var config = {
    data: {
      resources: {
        data: data, // resources are provided in an array. Instead, we could configure a request to the server.
        // Activities of the resources are provided along with the 'activities' property of resource objects.
        // Alternatively, they could be listed from the 'data.activities' configuration.
        activities: 'activities',
        name: 'name', // The name of the resource is provided with the name property of the resource object.
        id: 'id', // The id of the resource is provided with the id property of the resource object.
      },
      // As activities are provided along with the resources, this section only describes how to create
      // activity Gantt properties from the activity model objects.
      activities: {
        start: 'start', // The start of the activity is provided with the start property of the model object
        end: 'end', // The end of the activity is provided with the end property of the model object
        name: 'name', // The name of the activity is provided with the name property of the model object
      },
    },
};
5.配置与甘特图关联的工具栏。
var config = {
    toolbar: [
      'title',
      'search',
      'separator',
      {
        type: 'button',
        text: 'Refresh',
        fontIcon: 'fa fa-refresh fa-lg',
        onclick: function(ctx) {
          ctx.gantt.draw();
        },
      },
      'fitToContent',
      'zoomIn',
      'zoomOut',
    ],
};
6.初始化库以生成基本甘特图。
new Gantt('gantt', config);
7.将IBM甘特图实现为一个jQuery插件。
<!-- jQuery Library -->
<script src="jquery.min.js"></script>
<!-- jQuery Datatables plugin -->
<script src="jquery.dataTables.min.js"></script>
<link href="jquery.dataTables.min.css" rel="stylesheet" />
<!-- VIS Library -->
<script src="vis.min.js"></script>
<link href="vis.min.css" rel="stylesheet" type="text/css" />
<!-- IBM Gantt Chart -->
<link href="./dist/ibm-gantt-chart-jquery.css" rel="stylesheet" />
<script src="./dist/ibm-gantt-chart-jquery.js"></script>
new Gantt('gantt', config);
8.将IBM甘特图作为React组件来实现。
import React from 'react';
import ReactDOM from 'react-dom';
import GanttChart from 'ibm-gantt-chart-react';
import 'ibm-gantt-chart/dist/ibm-gantt-chart.css';
const config = { ... };
ReactDOM.render(<GanttChart config={config} />, document.getElementById('gantt'));
9.将IBM甘特图作为React组件来实现。
import React from 'react';
import ReactDOM from 'react-dom';
import GanttChart from 'ibm-gantt-chart-react';
import 'ibm-gantt-chart/dist/ibm-gantt-chart.css';
const config = { ... };
ReactDOM.render(<GanttChart config={config} />, document.getElementById('gantt'));
10.有关高级用法,请访问官方文档了解更多详细信息。
更新日志:
2023-04-14
- 版本0.5.29
预览截图
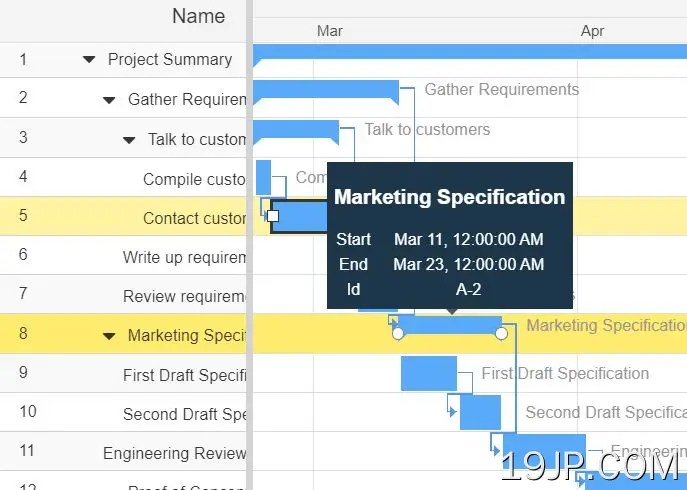 由IBM提供 全功能甘特图组件