最新资源
简介
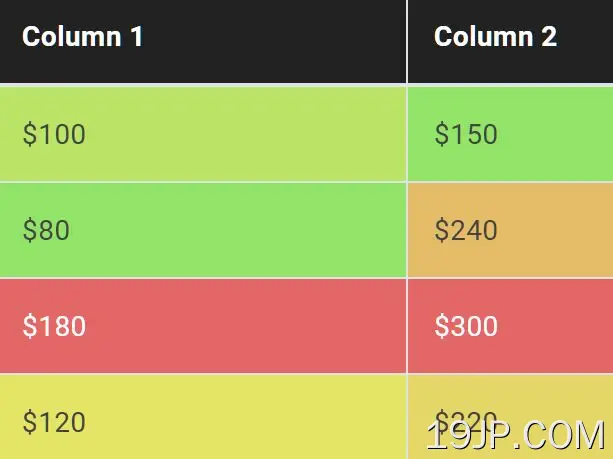
Column HeatMap是一个jQuery插件,通过根据特定列中的值对表单元格应用不同的背景色,使数据表更具可读性。
非常适合创建基于表格的热图来表示不同值表示为不同颜色的数据。
参见:
- 突出显示每行或每列中的最大/最小值-tableMinMax
- 基于元素值自动着色-jQuery ColorizeJS
- 可视化表格数据比较插件-jQuery表格比较
如何使用它:
1.在jQuery之后加载Column HeatMap插件的缩小版。
<script src="/path/to/cdn/jquery.slim.min.js"></script>
<script src="/path/to/dist/columnHeatmap.min.js"></script>
2.调用函数列热图在HTML表上,并确定要计算和比较值的列索引(从零开始)。
<table id="table">
  <thead>
    <tr>
      <th>Month</th>
      <th>Column 1</th>
      <th>Column 2</th>
    </tr>
  </thead>
  <tbody>
    <tr>
      <td>January</td>
      <td>$100</td>
      <td>$150</td>
    </tr>
    <tr>
      <td>February</td>
      <td>$80</td>
      <td>$240</td>
    </tr>
  </tbody>
</table>
$('#table').columnHeatmap({
  columns: [1] // required
});
3.确定是否根据背景动态更改文本颜色。默认值:true。
$('#table').columnHeatmap({
  columns: [1] // required
  contrast: false
});
4.确定是否恢复颜色。默认值:false。
$('#table').columnHeatmap({
  columns: [1] // required
  inverse: true
});
5.指定HSL颜色的起点(0-360)。
$('#table').columnHeatmap({
  columns: [1] // required
  colorStartPoint: 155
});
6.确定是否对着色值应用平滑过渡效果。默认值:true。
$('#table').columnHeatmap({
  columns: [1] // required
  animated: true,
  animationSpeed: .1
});
7.该插件还提供了一个自定义函数来解析单元格值。
$('#table').columnHeatmap({
  columns: [1] // required
  fn_parseValue: function(cell_value){
    cell_value = 1;
    return cell_value;
  }
});
更新日志:
2023-04-13
- 错误修复
