最新资源


简介
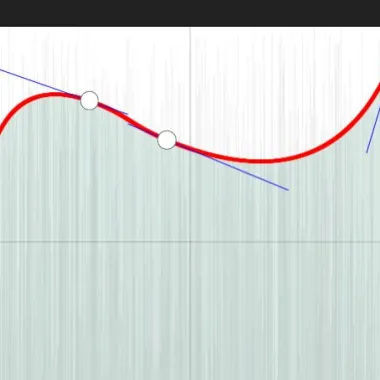
iocurve是一个完全可配置的jQuery插件,用于创建Photoshop和Lightroom风格的色调曲线UI,您可以通过鼠标拖动在给定的值范围内调整点。
更多功能:
- 自定义曲率。
- 自定义网格样式。
- 条形图(柱形图)。
- 自定义绘图图。
- 自定义直方图。
- 自定义连接线。
如何使用它:
1.创建一个容器来容纳色调曲线UI。
- <div class="iocurve"></div>
2.下载zip并在加载jQuery库后加载iocurve插件的缩小版。
- <script src="/path/to/cdn/jquery.min.js"></script>
- <script src="/path/to/dist/jquery.iocurve.min.js"></script>
3.调用容器元素上的函数,生成基本的音调曲线UI。
- $(function(){
- $('.iocurve').iocurve();
- });
4.自定义色调曲线UI。所有可能的默认选项:
- $('.iocurve').iocurve({
- // input/output value range
- x: [0, 255],
- y: [0, 255],
- // decomposition width
- dx: 1,
- // Y axis
- y0: 0,
- // curvature
- curvature: 0.3,
- // CSS class
- className: '',
- // CSS styles
- css: {
- position: 'relative',
- margin: '20px'
- },
- // canvas styles
- canvas: {
- height: '100%',
- css: {
- display: 'block',
- boxShadow: '0 0 3px #000'
- },
- fillStyle: '#fff'
- },
- // grid options
- grid: {
- visible: true,
- strokeStyle: 'rgba(0, 0, 0, 0.2)'
- },
- // anchor options
- anchor: {
- points: [ [0, 0], [255, 255] ],
- tagName: 'a',
- className: 'anchor',
- css: {
- position: 'absolute',
- display: 'block',
- width: 18,
- height: 18,
- borderRadius: '50%',
- border: '1px solid rgba(0, 0, 0, 0.5)',
- background: '#fff',
- boxSizing: 'border-box',
- cursor: 'move',
- transform: 'translate(-50%, -50%)'
- }
- },
- // bar styles
- bar: {
- visible: true,
- fillStyle: {
- positive: 'rgba(0, 100, 70, 0.2)',
- negative: 'rgba(150, 30, 70, 0.2)'
- }
- },
- // plot diagram styles
- plot: {
- visible: false,
- strokeStyle: '#f00'
- },
- // histogram styles
- histogram: {
- data: null,
- fillStyle: '#ddd'
- },
- // connection line styles
- controlPoint: {
- visible: false,
- strokeStyle: '#00f'
- }
- });
5.事件处理程序。
- var $curve = $('.iocurve').iocurve(option);
- $curve.on('anchor', function(ev, anchor){
- // anchor.element anchor DOM element
- // anchor.kind 'new'|'move'|'remove'
- // anchor.x coordinate X
- // anchor.y coordinate Y
- });
- $curve.on('output', function(ev, data){
- console.log(data);
- });
- $curve.on('anchors', function( ev, $anchors ){
- // $anchors is jQuery object of all anchor elements.
- // Caution: Do not modify $anchors. It is read-only. Because it is a managed object inside the plugin.
- $anchors.each(function() {
- // $(this) is one anchor.
- });
- });
6.API方法。
- $curve.trigger('data', [function( data ){
- // get data
- }]);
- $curve.trigger('option', [{
- // update options
- }]);
- // resize to fit the parent element.
- $curve.trigger('resized');
- // destroy the instance
- $curve.trigger('destroy');
更新日志:
2021-12-04
- v0.6.0:事件调用中的锚点
2020-08-30
- 版本0.5.0
2020-08-24
- 调整后的选项
- 更新的演示。
2020-08-23
- 添加的事件
预览截图
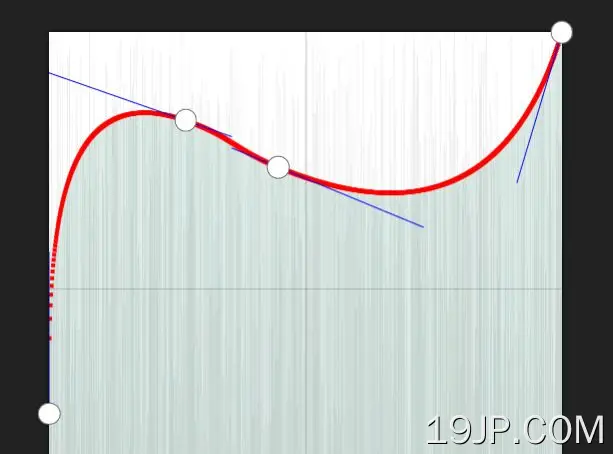 在jQuery iocurve中创建音调曲线UI组件