最新资源


简介
条形图是以图形方式显示数据的最常见方式之一。它很容易阅读,对数据集进行了快速而全面的概述。
在本文中,我将向您介绍一个名为barChat的全新插件,该插件可用于从JS数组中定义的数据集创建单个或堆叠的水平条形图。玩得高兴
如何使用它:
1.创建一个容器来容纳条形图。
- <div class="chart" id="graph">
- </div>
2.在JS对象数组中定义您的数据,如下所示:
- // single bar chart
- const myData = [
- {
- 'value': [17],
- 'color' :[], // bar colors
- 'labelColor' :['black'],
- 'barLabel': 'Label 1'
- },
- // ... more data here
- ];
- // stacked bar chart
- const myData = [
- {
- 'value': [17,1,3],
- 'color' :['red','yellow','green'],
- 'labelColor' :['black'],
- 'barLabel': 'Label 1'
- },
- // ... more data here
- ];
3.在jQuery之后加载barGraph.js。
- <script src="/path/to/cdn/jquery.slim.min.js"></script>
- <script src="/path/to/barGraph.js"></script>
4.使用以下选项自定义条形图。
- const myOptions = {
- // in pixels
- width: 500,
- height: 300,
- barSpacing: 4,
- graphFont: 16,
- // bottom, center, top
- barLabelPosition: 'center',
- yLableColor: 'green',
- backgroundBarColor: 'rgb(100,255,255)',
- titleFont: {size: 24, color: "black"},
- title: "Saying Thanks!",
- xAxisTitle: 'Average thank you\'s per day',
- xAxisTitleFont: {size: 24, color: "black"},
- // max value
- xMax: 60,
- // tick steps
- xsteps: 6
- };
5.初始化插件,并从您提供的数据集中绘制一个水平条形图。
- let myChart = $("#graph");
- drawBarChart(myData, myOptions, myChart);
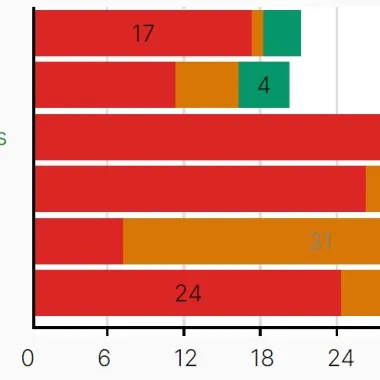
预览截图
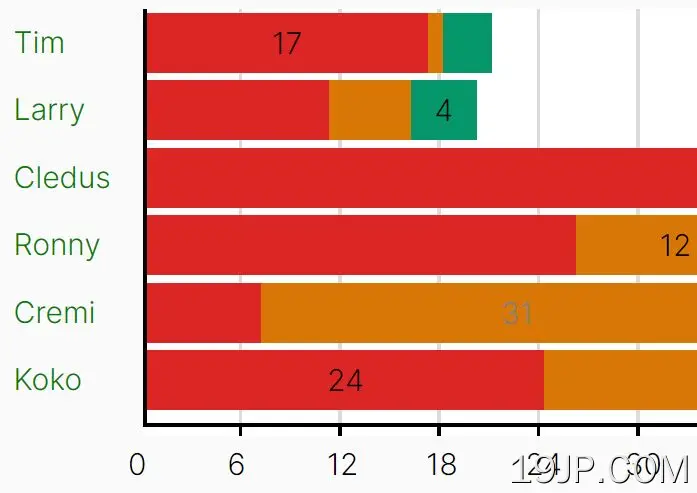 单堆叠水平条形图插件 jQuery条形图