最新资源


简介
Flot是一个JavaScript绘图库,与jQuery一起使用HTML5画布元素生成动态、有吸引力和交互式的图表。
您可能还喜欢jQuery Flot Animator插件来为您的Flot图表设置动画。
安装和下载:
# NPM
$ npm install flot --save
基本用法:
1.在页面上包含jQuery和Flot.js JavaScript库。
<script src="/path/to/jquery.js"></script>
<script src="/path/to/jquery.flot.js"></script>
<!--[if lte IE 8]>
<script src="/path/to/excanvas.min.js"></script>
<![endif]-->
2.为图表创建占位符元素。
<div id="placeholder"></div>
3.准备好要绘制在图表中的数据。
var data = [ ["January", 10], ["February", 8], ["March", 4], ["April", 13], ["May", 17], ["June", 9]];
4.根据数据数组生成一个基本折线图。
$.plot("#placeholder", data);5.自定义图表的所有默认选项。
$.plot("#placeholder", data,{
  // the color theme used for graphs
  colors: ["#edc240", "#afd8f8", "#cb4b4b", "#4da74d", "#9440ed"],
  xaxis: {
    show: null, // null = auto-detect, true = always, false = never
    position: "bottom", // or "top"
    mode: null, // null or "time"
    font: null, // null (derived from CSS in placeholder) or object like { size: 11, lineHeight: 13, style: "italic", weight: "bold", family: "sans-serif", variant: "small-caps" }
    color: null, // base color, labels, ticks
    tickColor: null, // possibly different color of ticks, e.g. "rgba(0,0,0,0.15)"
    transform: null, // null or f: number -> number to transform axis
    inverseTransform: null, // if transform is set, this should be the inverse function
    min: null, // min. value to show, null means set automatically
    max: null, // max. value to show, null means set automatically
    autoScaleMargin: null, // margin in % to add if autoScale option is on "loose" mode,
    autoScale: "exact", // Available modes: "none", "loose", "exact", "sliding-window"
    windowSize: null, // null or number. This is the size of sliding-window.
    growOnly: null, // grow only, useful for smoother auto-scale, the scales will grow to accomodate data but won't shrink back.
    ticks: null, // either [1, 3] or [[1, "a"], 3] or (fn: axis info -> ticks) or app. number of ticks for auto-ticks
    tickFormatter: null, // fn: number -> string
    showTickLabels: "major", // "none", "endpoints", "major", "all"
    labelWidth: null, // size of tick labels in pixels
    labelHeight: null,
    reserveSpace: null, // whether to reserve space even if axis isn't shown
    tickLength: null, // size in pixels of major tick marks
    showMinorTicks: null, // true = show minor tick marks, false = hide minor tick marks
    showTicks: null, // true = show tick marks, false = hide all tick marks
    gridLines: null, // true = show grid lines, false = hide grid lines
    alignTicksWithAxis: null, // axis number or null for no sync
    tickDecimals: null, // no. of decimals, null means auto
    tickSize: null, // number or [number, "unit"]
    minTickSize: null, // number or [number, "unit"]
    offset: { below: 0, above: 0 }, // the plot drawing offset. this is calculated by the flot.navigate for each axis
    boxPosition: { centerX: 0, centerY: 0 } //position of the axis on the corresponding axis box
  },
  yaxis: {
    autoScaleMargin: 0.02, // margin in % to add if autoScale option is on "loose" mode
    autoScale: "loose", // Available modes: "none", "loose", "exact"
    growOnly: null, // grow only, useful for smoother auto-scale, the scales will grow to accomodate data but won't shrink back.
    position: "left", // or "right"
    showTickLabels: "major", // "none", "endpoints", "major", "all"
    offset: { below: 0, above: 0 }, // the plot drawing offset. this is calculated by the flot.navigate for each axis
    boxPosition: { centerX: 0, centerY: 0 } //position of the axis on the corresponding axis box
  },

  // if you need more than one x axis or y axis
  xaxes: [],
  yaxes: [],

  // customize the data series
  series: {
    points: {
        show: false,
        radius: 3,
        lineWidth: 2, // in pixels
        fill: true,
        fillColor: "#ffffff",
        symbol: 'circle' // or callback
    },
    lines: {
        // we don't put in show: false so we can see
        // whether lines were actively disabled
        lineWidth: 1, // in pixels
        fill: false,
        fillColor: null,
        steps: false
        // Omit 'zero', so we can later default its value to
        // match that of the 'fill' option.
    },
    bars: {
        show: false,
        lineWidth: 2, // in pixels
        // barWidth: number or [number, absolute]
        // when 'absolute' is false, 'number' is relative to the minimum distance between points for the series
        // when 'absolute' is true, 'number' is considered to be in units of the x-axis
        horizontal: false,
        barWidth: 0.8,
        fill: true,
        fillColor: null,
        align: "left", // "left", "right", or "center"
        zero: true
    },
    shadowSize: 3,
    highlightColor: null
  },
  grid: {
    show: true,
    aboveData: false,
    color: "#545454", // primary color used for outline and labels
    backgroundColor: null, // null for transparent, else color
    borderColor: null, // set if different from the grid color
    tickColor: null, // color for the ticks, e.g. "rgba(0,0,0,0.15)"
    margin: 0, // distance from the canvas edge to the grid
    labelMargin: 5, // in pixels
    axisMargin: 8, // in pixels
    borderWidth: 1, // in pixels
    minBorderMargin: null, // in pixels, null means taken from points radius
    markings: null, // array of ranges or fn: axes -> array of ranges
    markingsColor: "#f4f4f4",
    markingsLineWidth: 2,
    // interactive stuff
    clickable: false,
    hoverable: false,
    autoHighlight: true, // highlight in case mouse is near
    mouseActiveRadius: 15 // how far the mouse can be away to activate an item
  },
  interaction: {
    redrawOverlayInterval: 1000 / 60 // time between updates, -1 means in same flow
  },
  hooks: {}
});
更新日志:
版本4.2.4(2023-01-21)
- 修复了步骤渲染不将最后一点与线连接的问题
v4.2.2 (2021-03-17)
- 解决水平条系列计算自动缩放范围的问题
版本4.2.1(2020-05-07)
- 修复了在水平条形图上显示y轴端点记号的问题
版本4.2.0(2020-02-05)
- 使现代化
第4.1.1版(2019-11-22)
- 清除鼠标离开时饼图悬停高亮显示。
第4.1.0版(2019-11-06)
- 引入新的钩子,允许用户扩展flot提供的findNearbyItems方法的默认行为。
版本4.0.0(2019-10-30)
- 创建一个新的主要版本,因为我们引入了一个更改,需要包含一个新脚本来保持正确的行为。这将取代从3.2.11开始发布的先前补丁。这也有一个小错误修复,用于修复条形图的悬停问题。
版本3.2.13(2019-10-16)
- 修复了微秒日期上毫秒值不一致的问题
版本3.2.12(2019-10-15)
- 对选择插件进行了小修复,以删除不需要的行。
版本3.2.11(2019-10-15)
- 修复了选择插件与其他使用拖动事件的插件一起使用的问题,即我们无法从单独插件的拖动处理程序中正确禁用选择插件拖动处理程序。
版本3.2.10(2019-09-25)
- 制定本地声明
第3.2.9版(2019-08-22)
- 同时为setData和重做绘图工作
第3.2.8版(2019-08-21)
- 修复重置时的移动
第3.2.7版(2019-08-09)
- 修复最近更改悬停插件后损坏的分发。
第3.2.5版(2019-08-02)
- 在数据中遇到NaN时,在绘图的线条渲染中引入间隙。
第3.2.4版(2019-07-30)
- 该插件现在捕获从CORS对样式表的请求中抛出的异常,以允许继续执行。发生这种情况时,它会在控制台中报告该问题。
第3.2.3版(2019年7月19日)
- 将选择模式设置为“null”将立即将其关闭。
第3.2.2版(2019-06-29)
- 修复优化更改结果的问题
v3.2.1(2019年6月27日)
- 修正了即使在没有数据的情况下,当轴autoScale设置为“松散”时,范围捕捉到值的问题
v3.2.0(2019年6月19日)
- 正在恢复加载CORS样式表的更改。
- 各种错误修复。
v3.1.1(2019年6月14日)
- 修复Safari上加载跨域样式表的问题。
v3.1.0(2019年5月31日)
- 引入第二个事件,当绘制完成时,源于placeHolder
- 修复了在跨域上下文中样式表不起作用的问题
- 修复了新版Chrome引入的Math.pow()问题。
3.0.0版(2019年4月3日)
- 修复悬停插件中的内存泄漏。
版本3.0.0(2019-03-23)
- 更改:设置平移:{enableTouch:true}将不再自动打开用于触摸支持的捏手势。现在可以通过设置缩放来打开捏手势:{enableTouch:true}。现在可以选择性地关闭重新居中的双击(或点击)机制。最后,我们提供了一个选项,允许事件为导航插件处理的手势传播,无论它们是否启用。
v2.3.2版本(2019-03-22)
- 修复了扩展Date类导致babel出现问题的问题。
v2.3.1版本(2019-03-21)
- 添加微秒作为轴的timeBase设置选项。各种错误修复。
- 修复了从缩小的源代码中使用悬停插件时的错误。
v2.2.1版本(2019-03-05)
- 为鼠标和触摸交互添加了新的平移模式。
v2.2.0版本(2019-02-27)
- 为鼠标和触摸交互添加了新的平移模式。
- 修复了空字符串刻度标签被自动生成的标签替换的问题。
- 修正了悬停在条形图上不再工作的问题。
- 修复了再次更新图例的跟踪示例。
- 修复了堆叠图形的工具提示不正确的问题。
v2.1.6版本(2019-02-12)
- 更新到最新版本。
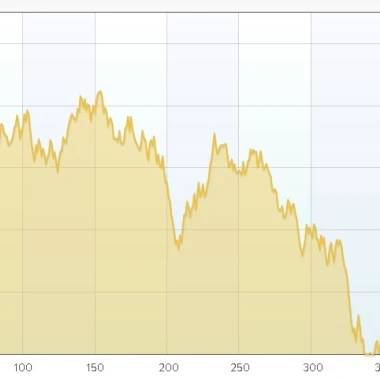
预览截图
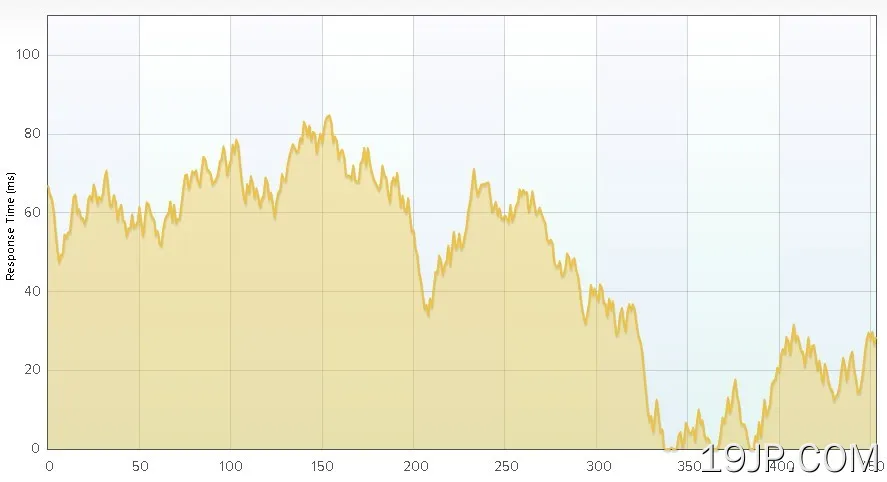 jQuery 吸引人 绘图插件 Flot