最新资源


简介
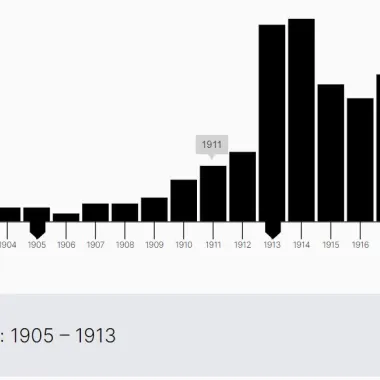
基本日期范围选择器的绝佳替代品。
DateRange UI jQuery插件结合了柱状图和日期范围选择器,提供了一个可视化的日期选择UI。
重量轻、动感十足、易于使用、反应灵敏且便于触摸。
基于jQuery和d3.js库构建。
如何使用它:
1.加载所需的jQuery和d3.js库。
<script src="/path/to/cdn/jquery.min.js"></script>
<script src="/path/to/cdn/d3.min.js"></script>
2.在jQuery之后加载DateRange UI的脚本。
<script src="plugin.js"></script>
3.创建一个empty DIV来容纳柱状图和日期范围选择器。
<div id="graph"></div>
4.为柱状图准备时间序列数据。
var myData = [
    {
      // year name
      "key_as_string":"1903",
      // value
      "doc_count":2,
      // unix timestamp in milliseconds
      "key":-2114384400000
    },
    {
      "key_as_string":"1904",
      "doc_count":7,
      "key":-2082848400000
    },
    // ...
]
5.初始化插件以生成一个柱状图,并在其底部生成一个自定义日期范围选择器。
const graph = $("#graph").daterangeselect({
      data: myData,
      // more options here
});
6.DateRange UI的可用选项。
const graph = $("#graph").daterangeselect({
      data: myData,
      height: 320,
      rangeBarOpacity: 0.4,
      handleScaleFactor: 1.6,
      dataLengthTrigger: 30 // show tick values on x-axis for each bar or every 10th element
});
7.覆盖默认样式。
#graph {
  position: relative;
  width: 100%;
}

#range {
  color: #fff;
  font-size: 20px;
  background-color: #d81b60;
  padding: 5px 10px;
}

#graph text {
  fill: #ccc;
}

#graph tik {
  fill: #ccc;
}

#graph .domain, #graph line {
  stroke: #ccc;
}

#graph .bars .bar {
  fill: #bdb7b7;
}

#graph .bars .bar.highlight {
  fill: #d81b60 !important;
}

#graph .bars .axis--x path {
  display: none;
}

#graph .bars .bar.selected {
  fill: #fff;
}

#graph .handles .selector {
  fill: #fff;
  stroke: #777;
  stroke-width: 0.5px;
}

#graph .handles .selector.hovereffekt {
  stroke-width: 15px;
  stroke-opacity: 0.1;
  stroke: #eee;
}

#graph .handles .selector.active {
  fill: #ccc !important;
}

#graph .handles .range {
  fill: #fff; /* #d81b60 */
  stroke: none;
}

#graph .handles .selector .handlehovertext {
  fill: #fff;
  stroke: none;
  font-size: 11px;
  font-family: Helvetica, Arial;
}

#graph .empty line {
  stroke: #d81b60 !important;
}

#graph .empty text {
  /* fill: #d81b60 !important; */
}
8.自定义将鼠标悬停在柱状图上时显示的工具提示。
#graph div.tooltip {
  position: absolute;
  text-align: center;
  width: 40px;
  height: 24px;
  padding-top: 5px;
  font: 12px sans-serif;
  background: #ccc;
  border: 0px;
  border-radius: 2px;
  pointer-events: none;
  color: #333;
}

#graph div.tooltip:after {
  box-sizing: border-box;
  display: inline;
  width: 100%;
  line-height: 1;
  color: #ccc;
  content: "\25BC";
  position: absolute;
  text-align: center;
  margin: -3px 0 0 0;
  top: 100%;
  left: 0;
}
9.回调函数。
const graph = $("#graph").daterangeselect({
      data: myData,
      onRangeUpdate: function (obj) {
        //var myJSON = JSON.stringify(obj);
        //console.log("Clicked Section Data",obj);
      },
      hoverText: function (obj) {
        return obj.key_as_string;
      }
});
10.更新柱状图。
$("#graph").daterangeselect("update", newData);
预览截图
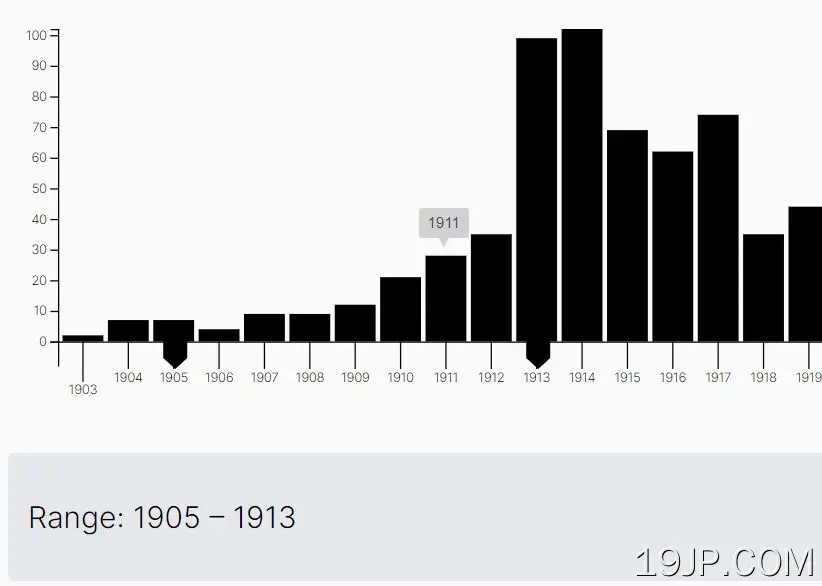 从柱状图中选择日期范围 日期范围UI