最新资源


简介
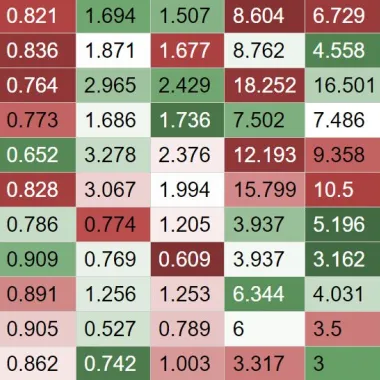
TableCompare是一个很小的jQuery插件,用于显示带有颜色映射的表格数据。支持二进制(二进制阈值)或线性插值模式。
参见:
- 突出显示每行或每列中的最大/最小值-tableMinMax
- 基于元素值自动着色-jQuery ColorizeJS
- 为表格列中的数值着色-列HeatMap
如何使用它:
1.在页面上创建一个空的表元素。
<table id="example">
</table>
2.准备表格数据。
var headers = ['Subject', 'Dice 1', 'Dice 2', 'Adb 1', 'Adb 2', 'Hdb 1', 'Hdb 2', 'Sens 1', 'Sens 2', 'Spec 1', 'Spec 2'];
var data = [
    ['averages', 0.68, 0.821, 1.694, 1.507, 8.604, 6.729, 0.698, 0.848, 0.998, 0.998],
    ['ProstateDx-03-0005', 0.695, 0.836, 1.871, 1.677, 8.762, 4.558, 0.767, 0.756, 0.998, 0.999],
    ['ProstateDx-03-0004', 0.699, 0.764, 2.965, 2.429, 18.252, 16.501, 0.789, 0.876, 0.997, 0.997],
    ['ProstateDx-03-0003', 0.697, 0.773, 1.686, 1.736, 7.502, 7.486, 0.747, 0.766, 0.998, 0.999],
    ['ProstateDx-03-0002', 0.348, 0.652, 3.278, 2.376, 12.193, 9.358, 0.346, 0.695, 0.997, 0.996],
    ['ProstateDx-03-0001', 0.651, 0.828, 3.067, 1.994, 15.799, 10.5, 0.856, 0.774, 0.994, 0.998],
    ['Prostate3T-03-0005', 0.672, 0.786, 0.774, 1.205, 3.937, 5.196, 0.555, 0.939, 1, 0.998],
    ['Prostate3T-03-0004', 0.812, 0.909, 0.769, 0.609, 3.937, 3.162, 0.751, 0.947, 0.999, 0.999],
    ['Prostate3T-03-0003', 0.625, 0.891, 1.256, 1.253, 6.344, 4.031, 0.559, 0.941, 0.999, 0.995],
    ['Prostate3T-03-0002', 0.837, 0.905, 0.527, 0.789, 6, 3.5, 0.876, 0.886, 0.999, 0.999],
    ['Prostate3T-03-0001', 0.766, 0.862, 0.742, 1.003, 3.317, 3, 0.732, 0.902, 0.999, 0.998]
];
3.加载jQuery表比较插件。
<script src="/path/to/cdn/jquery.slim.min.js"></script>
<script src="/path/to/table-compare.js"></script>
4.初始化HTML表上的插件。可能的参数:
- 数据:要显示的数据矩阵。按行主要顺序排列的二维数字数组。
- 基线:要进行比较的基线矩阵。按行主要顺序排列的二维数字阵列;必须与数据参数的大小相同。任何不应在数字上与其在数据数组中对应的单元格进行比较的元素都应设置为null。
- 配置:配置选项。
var baselineBinary = new Array(data.length);
    baselineInterp = new Array(data.length);

// Invent some random but sensible baseline data
for (var i = 0; i < data.length; i++) {
    baselineBinary[i] = new Array(data[i].length);
    baselineInterp[i] = new Array(data[i].length);
    baselineBinary[i][0] = null;
    baselineInterp[i][0] = null;
    for (var j = 1; j < data[i].length; j++) {
        // For binary coloring, each baseline is simply the threshold
        // to distinguish between two classes.
        baselineBinary[i][j] = Math.random() * 2 * data[i][j];

        // For linear interpolation, each baseline value is a 2-tuple
        // where the first value is the baseline and the second value is the
        // slope of lightness as a function of scalar deviation from baseline.
        baselineInterp[i][j] = [Math.random() * 2 * data[i][j], 1.5*data[i][j]];
    }
}

$(function () {

  // binary mode
  $('#example').compareTable(data, baselineBinary, {
    headers: headers,
    mode: 'binary'
  });

  // linterp mode
  $('#example').compareTable(data, baselineInterp, {
    headers: headers,
    mode: 'linterp',
  });

});
5.所有可用的配置选项。
$('#example').compareTable(data, baselineBinary, {
  headers: null,
  styleAttribute: 'backgroundColor',
  mode: 'binary',
  highColor: {r: 204, g: 119, b: 119},
  lowColor: {r: 119, g: 170, b: 119},
  nullColor: {r: 255, g: 255, b: 255},
  dynamicTextColor: false
});
预览截图
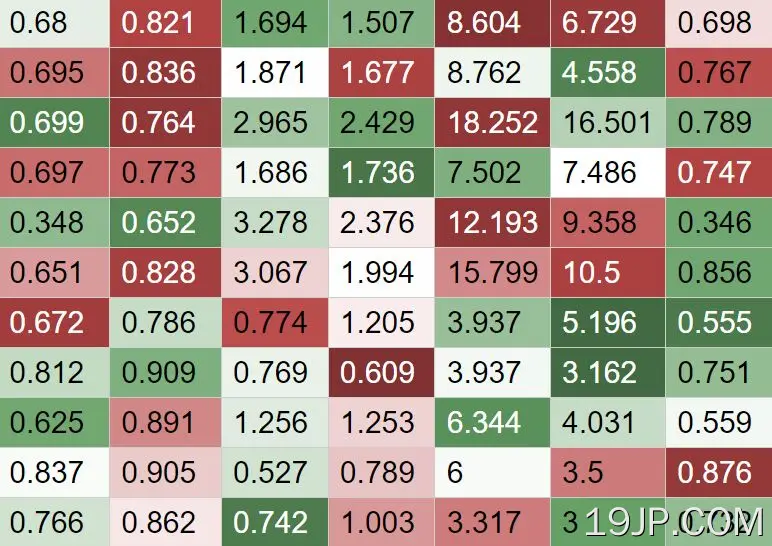 可视化表格数据比较插件 jQuery表格比较