最新资源


简介
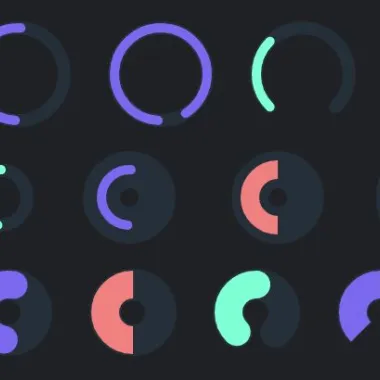
Donutty是一个JavaScript/jQuery图表库,可以使用SVG和CSS3动画生成平滑动画、完全可扩展的Donut/Pie/RingCharts或Circular/Radial进度条。
还附带了一个普通的JavaScript版本,它允许您在没有任何第三依赖项的情况下实现图表库。
参见:
- 10个最佳循环/径向进度条JavaScript插件
安装和下载:
# Yarn
$ yarn add donutty

# NPM
$ npm install donutty --save
如何使用它(jQuery版本):
1.在文档中加载最新的jQuery(slim build)和JavaScript文件“donutty jQuery.js”。
<script src="jquery.slim.min.js"></script>
<script src="dist/donutty-jquery.js"></script>
2.要创建默认图表,只需将“data donutty”属性添加到占位符元素即可。
<div data-donutty></div>
3.或者调用占位符元素上的函数:
const myChart = $("#example").donutty({
      // options here
});
4.通过自定义图表数据选项属性,或者将选项传递给donutty()方法,如下所示:
<div data-donutty
     data-radius=20
     data-thickness=40
     data-padding=0
     data-round=false
     data-color="lightcoral"
     data-value=80
     ...>
</div>
// or
const myChart = $("#example").donutty({
      min: -100,
      max: 100,
      value: 50
});
5.所有默认配置选项。
const myChart = $("#example").donutty({

      // min/max values
      min: 0,
      max: 100,

      // current value
      value: 50,

      // rounded edges or not
      round: true,

      // complete circle or not
      circle: true,

      // padding in pixels
      padding: 4,

      // radius in pixels
      radius: 50,

      // thickness in pixels
      thickness: 10,

      // background color
      bg: "rgba(70, 130, 180, 0.15)",

      // bar color
      color: "mediumslateblue",

      // transition effect
      transition: "all 1.2s cubic-bezier(0.57, 0.13, 0.18, 0.98)",

      // a String that can accept "rtl" for right-to-left modes
      dir: false,

      // or "bottom"
      // start the Donut's filling from the Top instead of always from the Bottom.
      anchor: "top",

});
6.自定义图表中显示的文本、标题和说明。
const myChart = $("#example").donutty({

      text: function( state ) {
        return ( state.value / ( state.max - state.min ) * 100 ) + "%";
        // return the percentage of the donut
      },

      title: function() {
        return "Donut Chart Graphic";
      },

      desc: function( v ) {
        return "A donut chart ranging from " + v.min + " to " + v.max + " with a current value of " + v.value + ".";
      };

});
7.更新图表的选项/值/统计数据。
// min, max, value
myChart.set( "value", 60 )

// min, max, value, bg, color, etc
myChart.setState({
  options here
})
更新日志:
v2.4.0版本(2022-10-19)
- 现在可以从顶部开始填充甜甜圈,而不是总是从底部开始。
v2.3.1 (2021-12-08)
- 修复rotate safari错误
第2.2.0版(2021-01-31)
- 添加辅助功能支持
v2.0.0版本(2019-11-04)
- 修复响应性、classList、bump包
v1.2.3 (2019-06-28)
- 在Firefox上修复宽度/高度
v1.2.2 (2019-06-26)
- 代码重构器
v1.2.1(2019年6月10日)
- 不再引发关于设置不存在的文本元素样式的错误。
Â
预览截图
 jQuery和SVG 动画甜甜圈/饼图/环形图 Donutty